Results from the rainfall limitation experiment
Soil water status
Soil water content
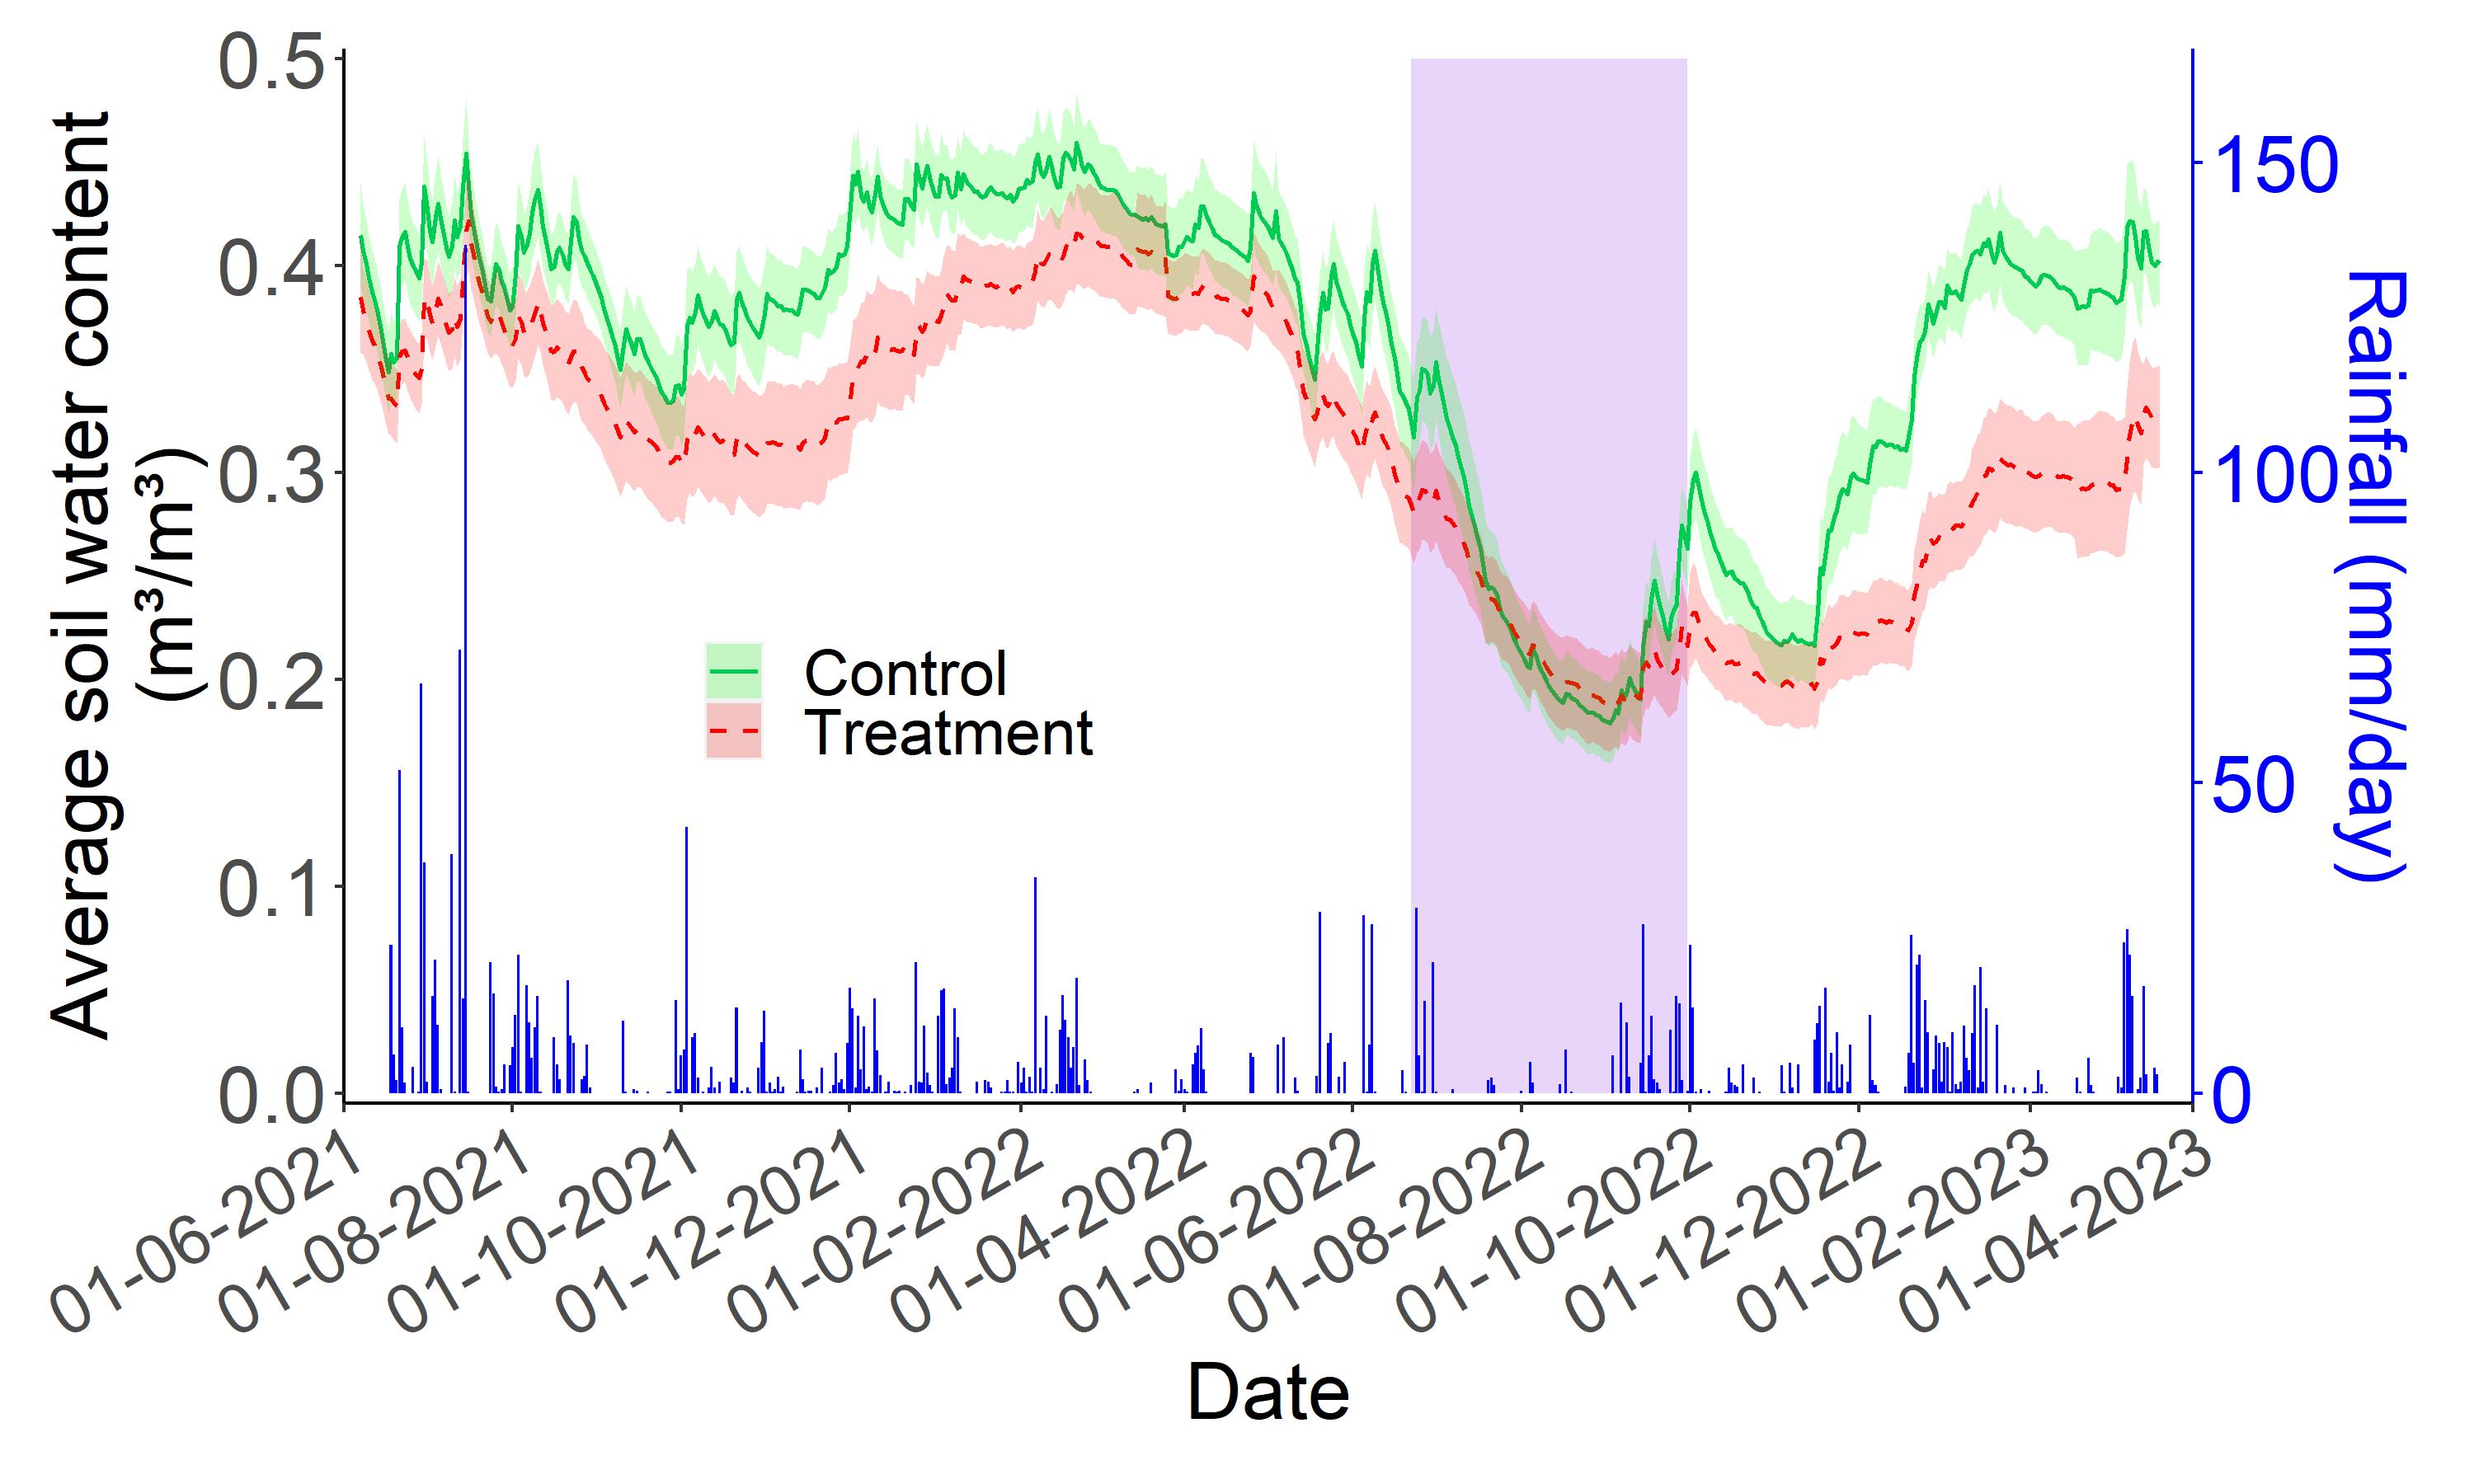
The temporal dynamics of the average volumetric soil water content (SWC) measured for the upper 30 cm soil layers in the experimental units of the rainfall limitation experiment is presented in the adjacent graph for the 07/06/2021-20/03/2023 period. During most of the first growing season (07/2021-08/2021), SWC values remained high given the large rainfall depth observed during that period, especially during July. Yet, systematically lower average SWC values were found under the roofs (treatment) compared with control units, though the differences were sometimes limited. After a SWC decrease during a drier period in September 2021, larger differences were observed due to a faster SWC recharge in the control until reaching maximum SWC values in early spring 2022 where the treatment effect is again reduced. Then, a general SWC decrease occurred, especially in the treatment for which temporary SWC recharge peaks due to rainfall events were much more attenuated compared with the control.
Read more
The SWC decrease was particularly pronounced for the severe drought period from 07/2022 to 09/2022 at the end of witch very low SWC values around 0.18 m³/m³ were observed in both the control and the treatment. When the rain was back, the SWC recharge was again faster for the control, leading to much higher SWC values in the control compared with the treatment. In contrast to observations in 2022 at the same period, SWC differences between both modalities remained large at the start of spring. These results indicate that the roofs generally significantly reduce SWC, except when soil are very dry due to severe drought. Moreover, the roof effect is particularly marked during the post-drought recharge period and it will probably persist in the next months, at least until sufficient rainfall occurs to rise SWC up to saturation under the roofs.
Soil water potential
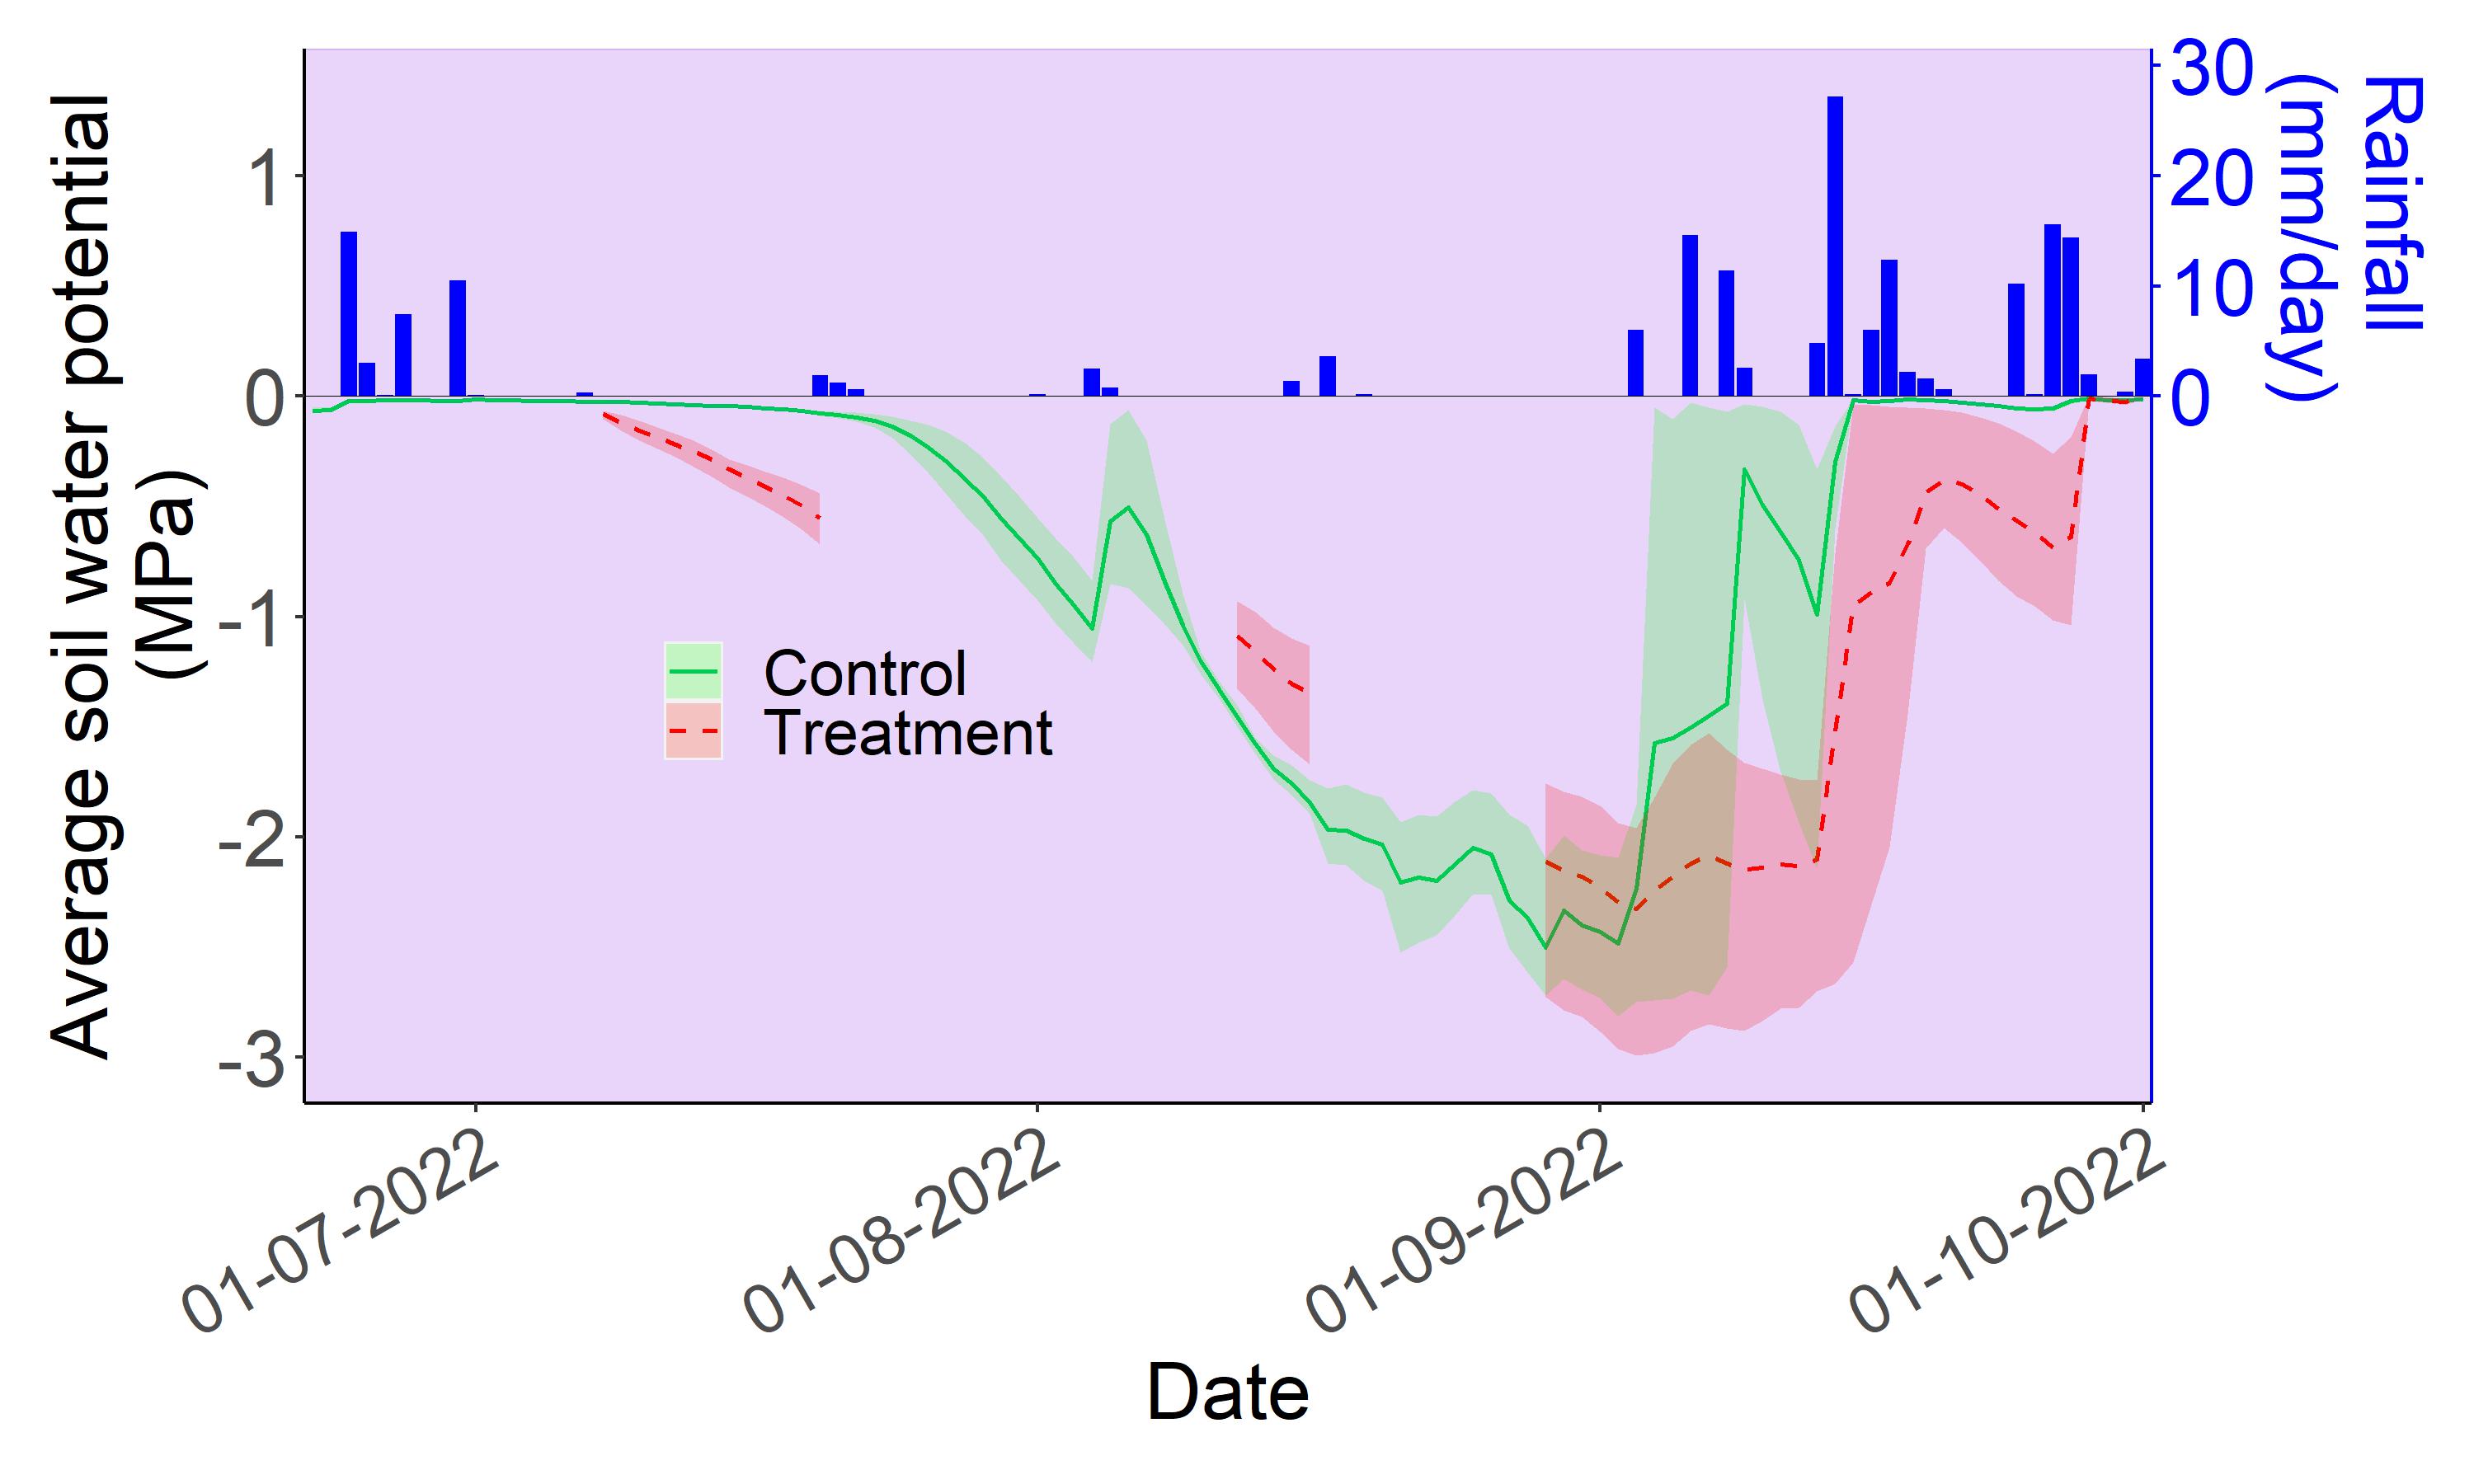
Lines are daily average values and shaded areas around the lines delimit minimum and maximum values.
Source for rainfall data: https://www.cra.wallonie.be/fr/agromet
The variation of soil water potential measured during summer 2022 in the more intensively equipped beech experimental zone presents similar patterns in the control and the treatment units, with a progressive decrease during the drought period followed by a rapid increase once rainfall occurs again. Yet, the decrease started earlier in the treatment while, similarly to SWC, the recovery was somewhat delayed compared with the control.
Seedling water status
Stem water potential
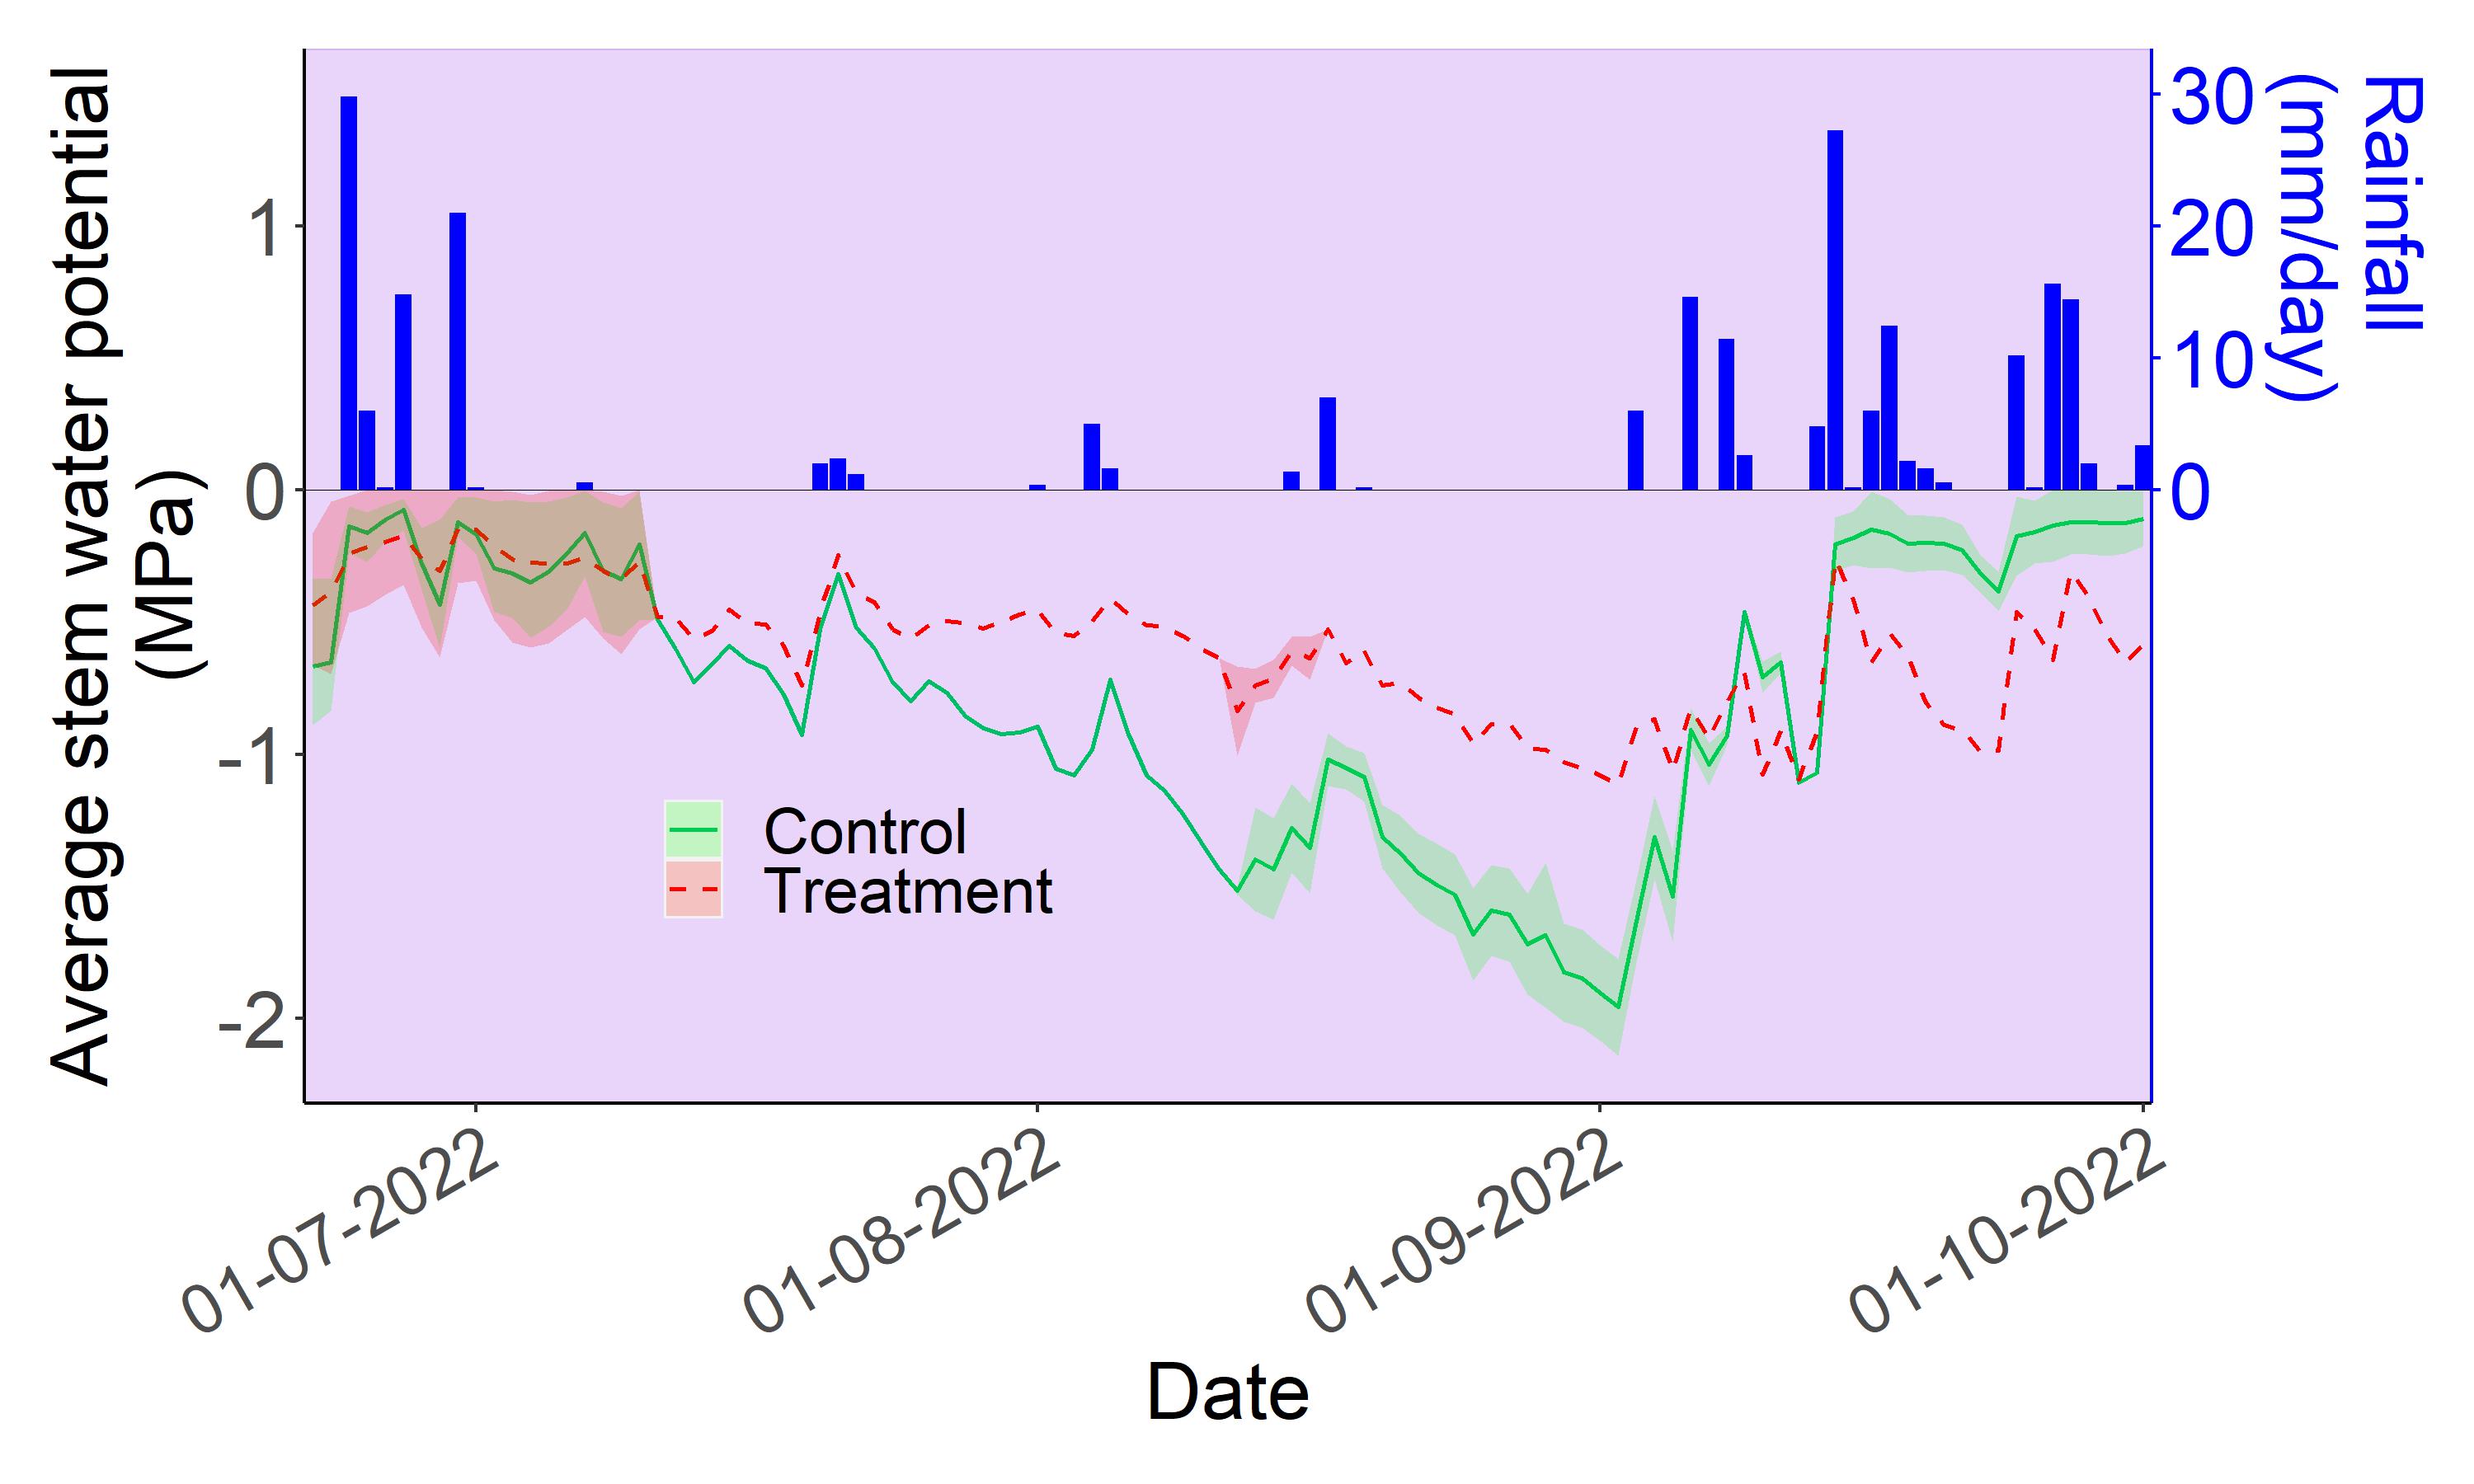
Lines are daily average values and shaded areas around the lines delimit minimum and maximum values.
Source for rainfall data: https://www.cra.wallonie.be/fr/agromet
The stem water potential measured on seedlings during the same period as above for soil water potential also decreased progressively during the drought, before increasing during the subsequent rainfalls. Nevertheless, stem water potential variations were much more pronounced for the control compared with the treatment, giving rise to more negative stem water potential values for the seedlings in the control and to increasing differences between both units as the drought progressed. These results would indicate that the seedlings under the roof were less stressed than those in the control. Several hypotheses can be made to explain these quite unexpected results.
Read more
A first hypothesis could be that seedlings of both modalities presented contrasted fine root abundances and distributions. Such differences could result from a higher root mortality by anoxia for the seedlings in the control that were subject to higher SWC levels during the preceding wet summer of 2021 and/or from the development of fine roots in more deeper soil horizons by the seedlings under the roof as an adaptation to the drier conditions. Another explanation would be that the seedlings in the treatment were exposed to less stressful conditions due to the lower radiation reaching them compared with the control. This hypothesis is supported by the lower PAR radiation levels measured in the treatment compared with the control (data not shown), which would partly arise from the interception of a part of the radiation by the roof structure but might also result from contrasted light environments for the two modalities within the stand, although these are only a few meters apart. The analysis of the hemispherical photos taken above each unit (and above the roof in the case of the treatment unit) reveals that, for the period corresponding to those measurements, the average percentage of the incident PAR radiation that reached the treatment was around 3% while it amounted to 9% for the control unit. This indicates that the differences in radiation levels between both units would mainly arise from a ‘location’ effect and that the ‘roof’ effect would be relatively minor. Given these different exposures to radiation, the seedlings under the roof would have been subject to a lower atmospheric demand for water than in the control. Finally, a lack of control of the measurement variability due to the low number of repetitions (i.e., 1 or 2 repetitions for each modality, depending on the period) might also partly explain such results.
Leaf water potential
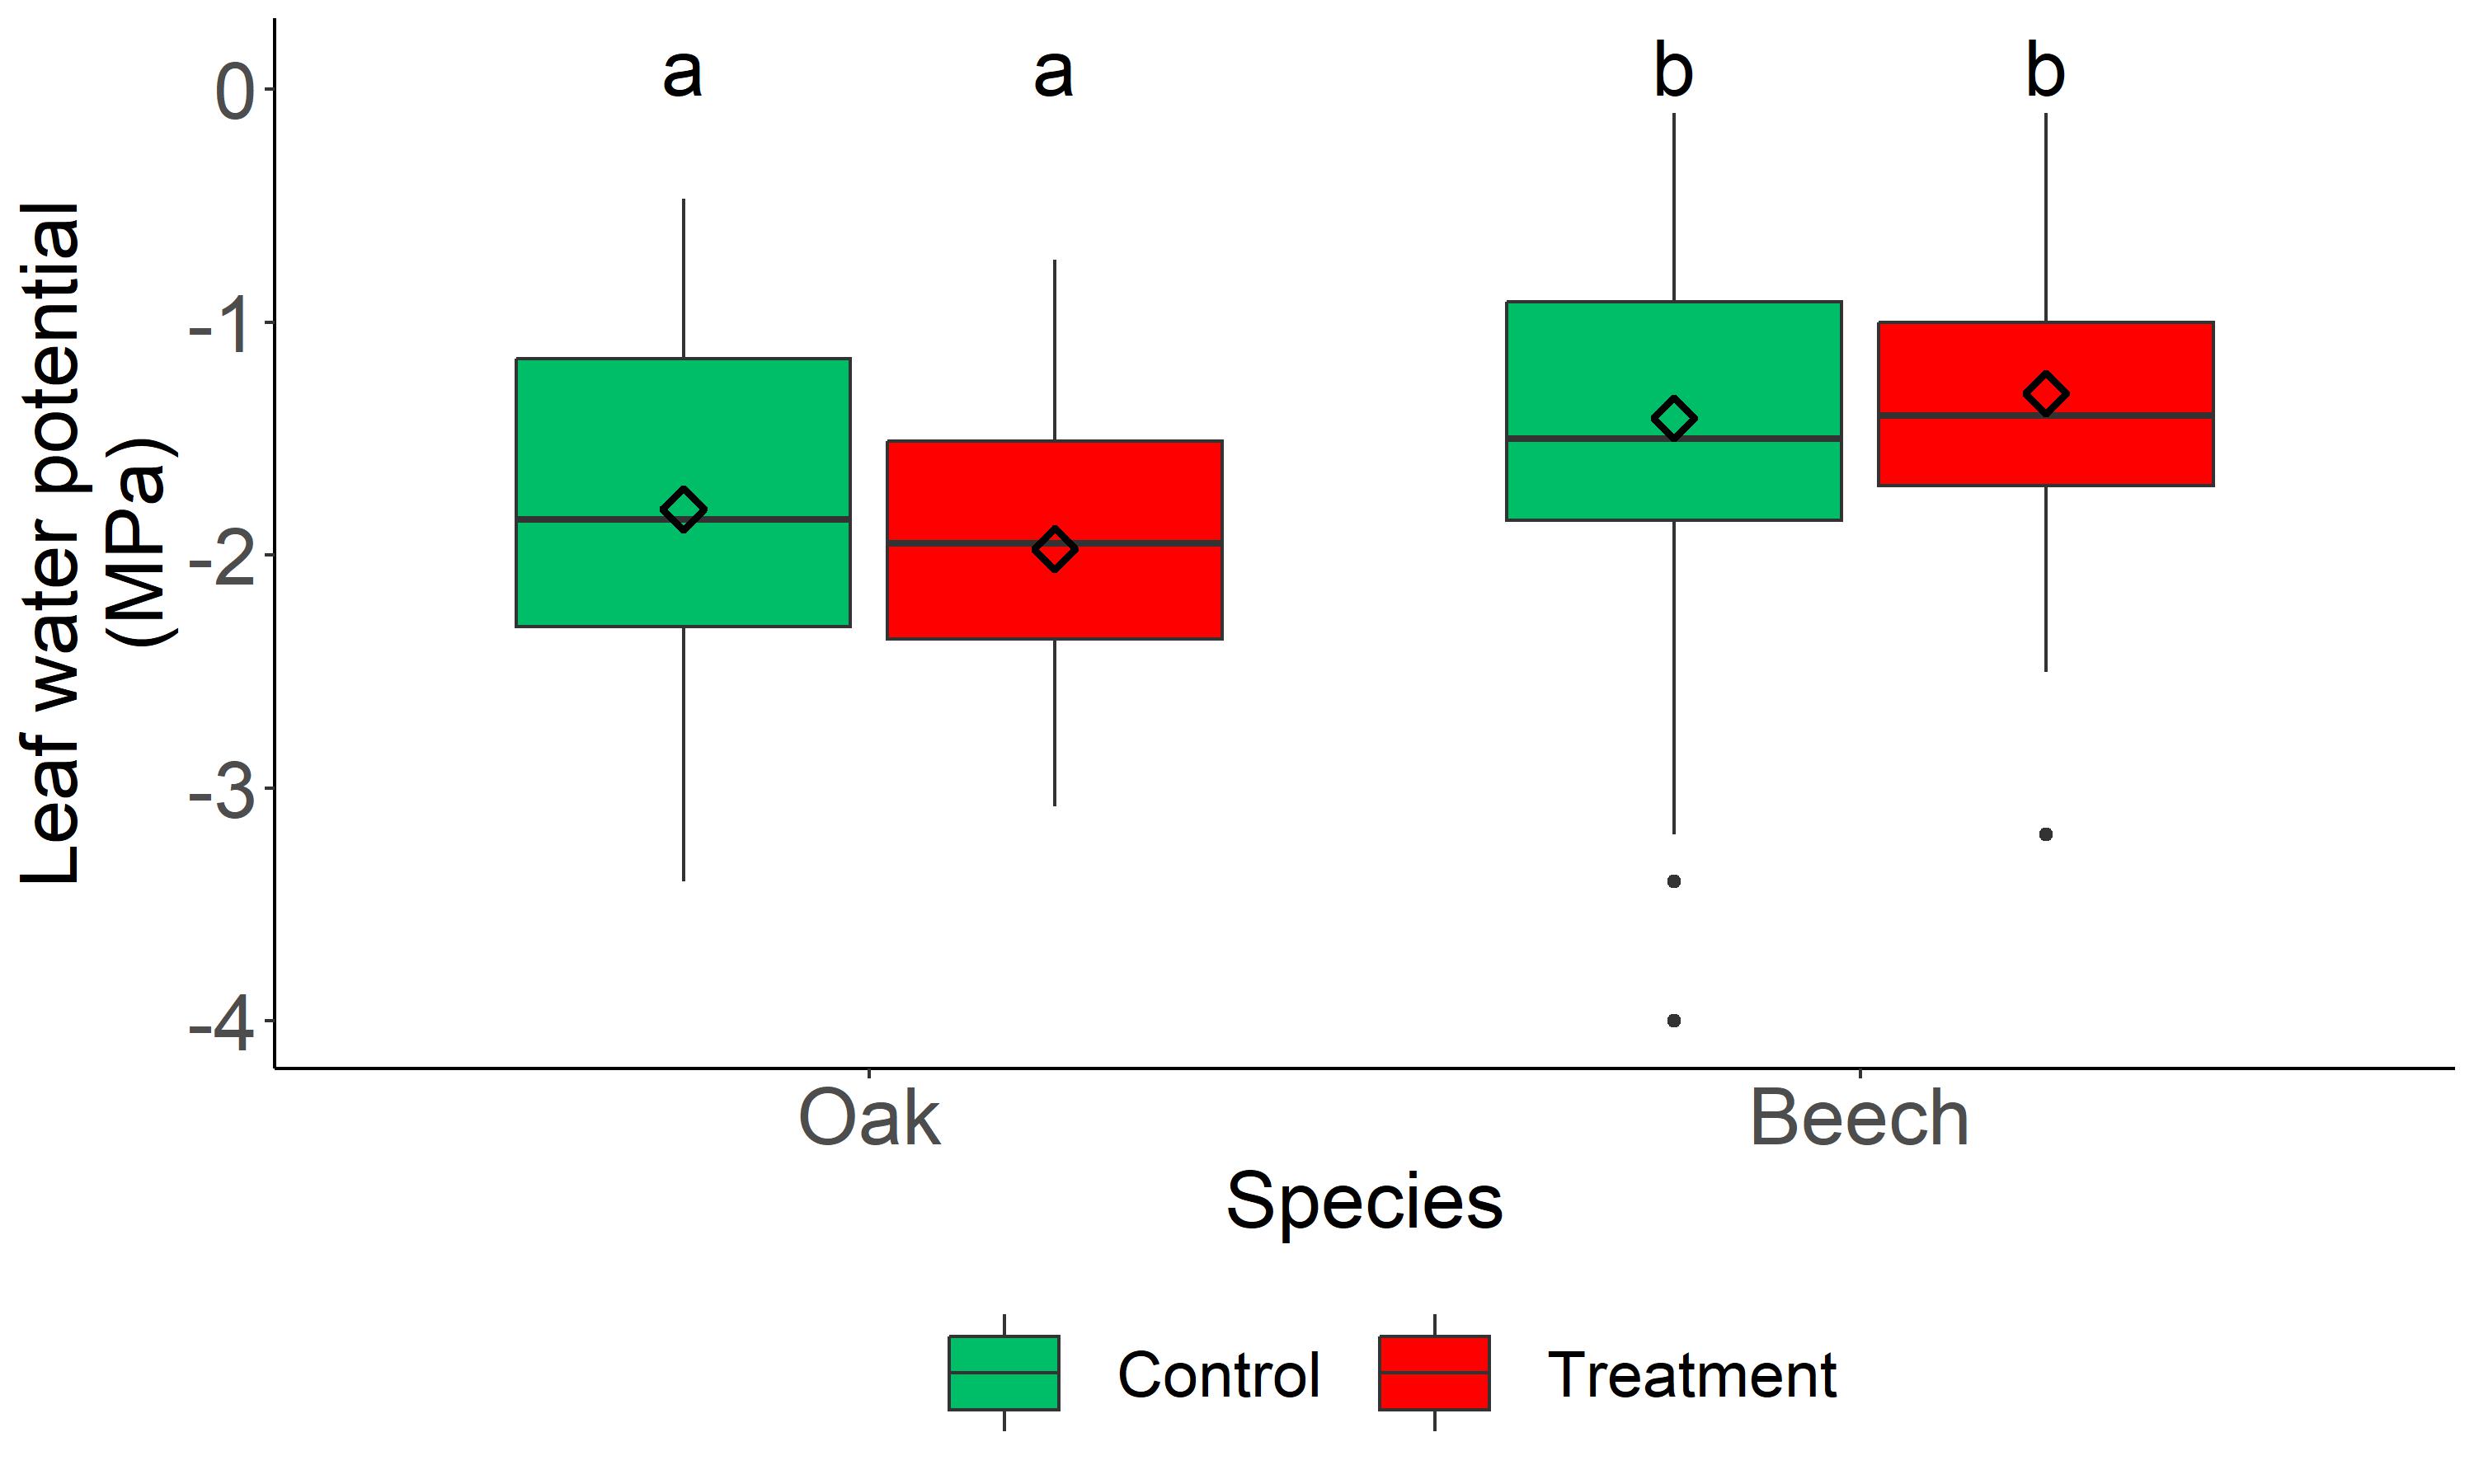
The lower and upper limits of the boxes represent the 25th and 75th data percentiles, respectively, while the intermediate lines correspond to the medians and the diamond symbols represent the means. The lower and upper whiskers are respectively minimum and maximum values. Dots are extreme values considered as outliers.
Different letters indicate statistically significant differences (P ≤ 0.05).
Leaf water potential measured in all experimental units using the Scholander bomb shows somewhat higher values (i.e., less negative values) for beech than for oak, which might be explained by contrasting responses of both species when facing with drought. Indeed, beech is acknowledged to limit the variations of water potential through rapid stomata closure when dry conditions appear (isohydric strategy) while oak is known to keep its stomata open and maintain high photosynthetic but also transpiration rates for longer periods, leading thereby to a significant decrease of water potential under stressful conditions (anisohydric strategy).
In other respects, for both species, the treatment effect is systematically not significant.
Dendrometric measurements
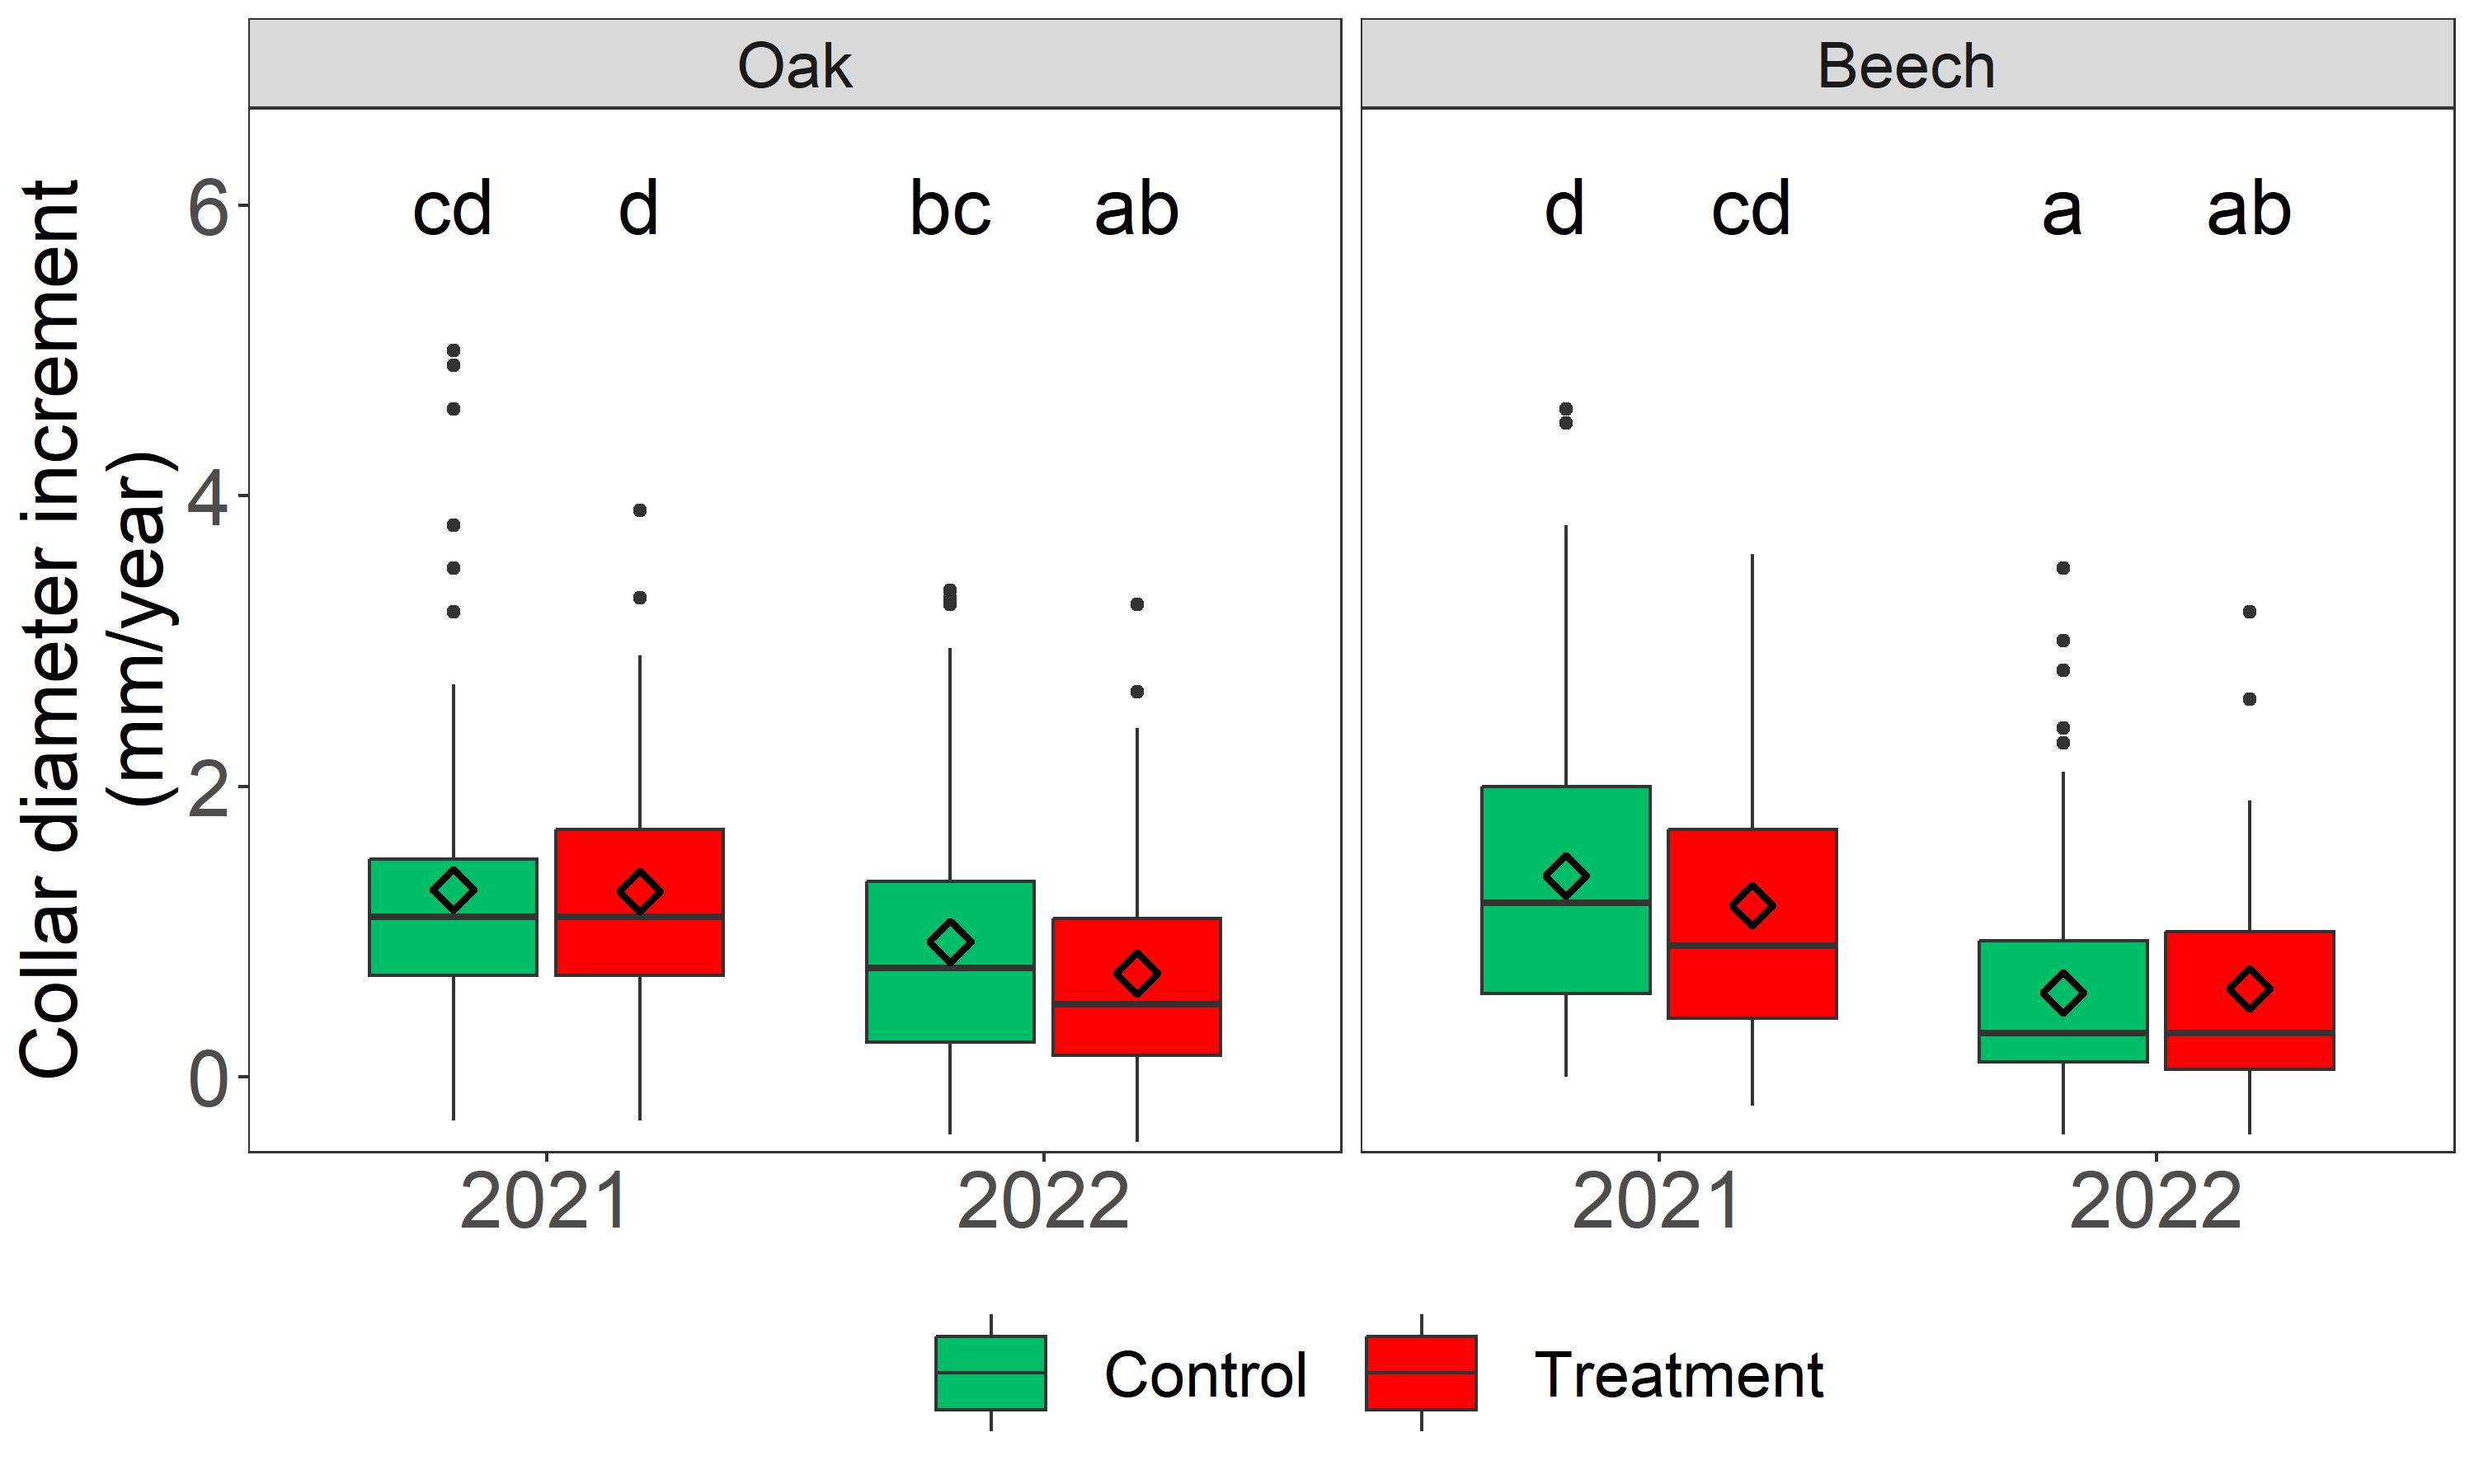
Collar diameter increment
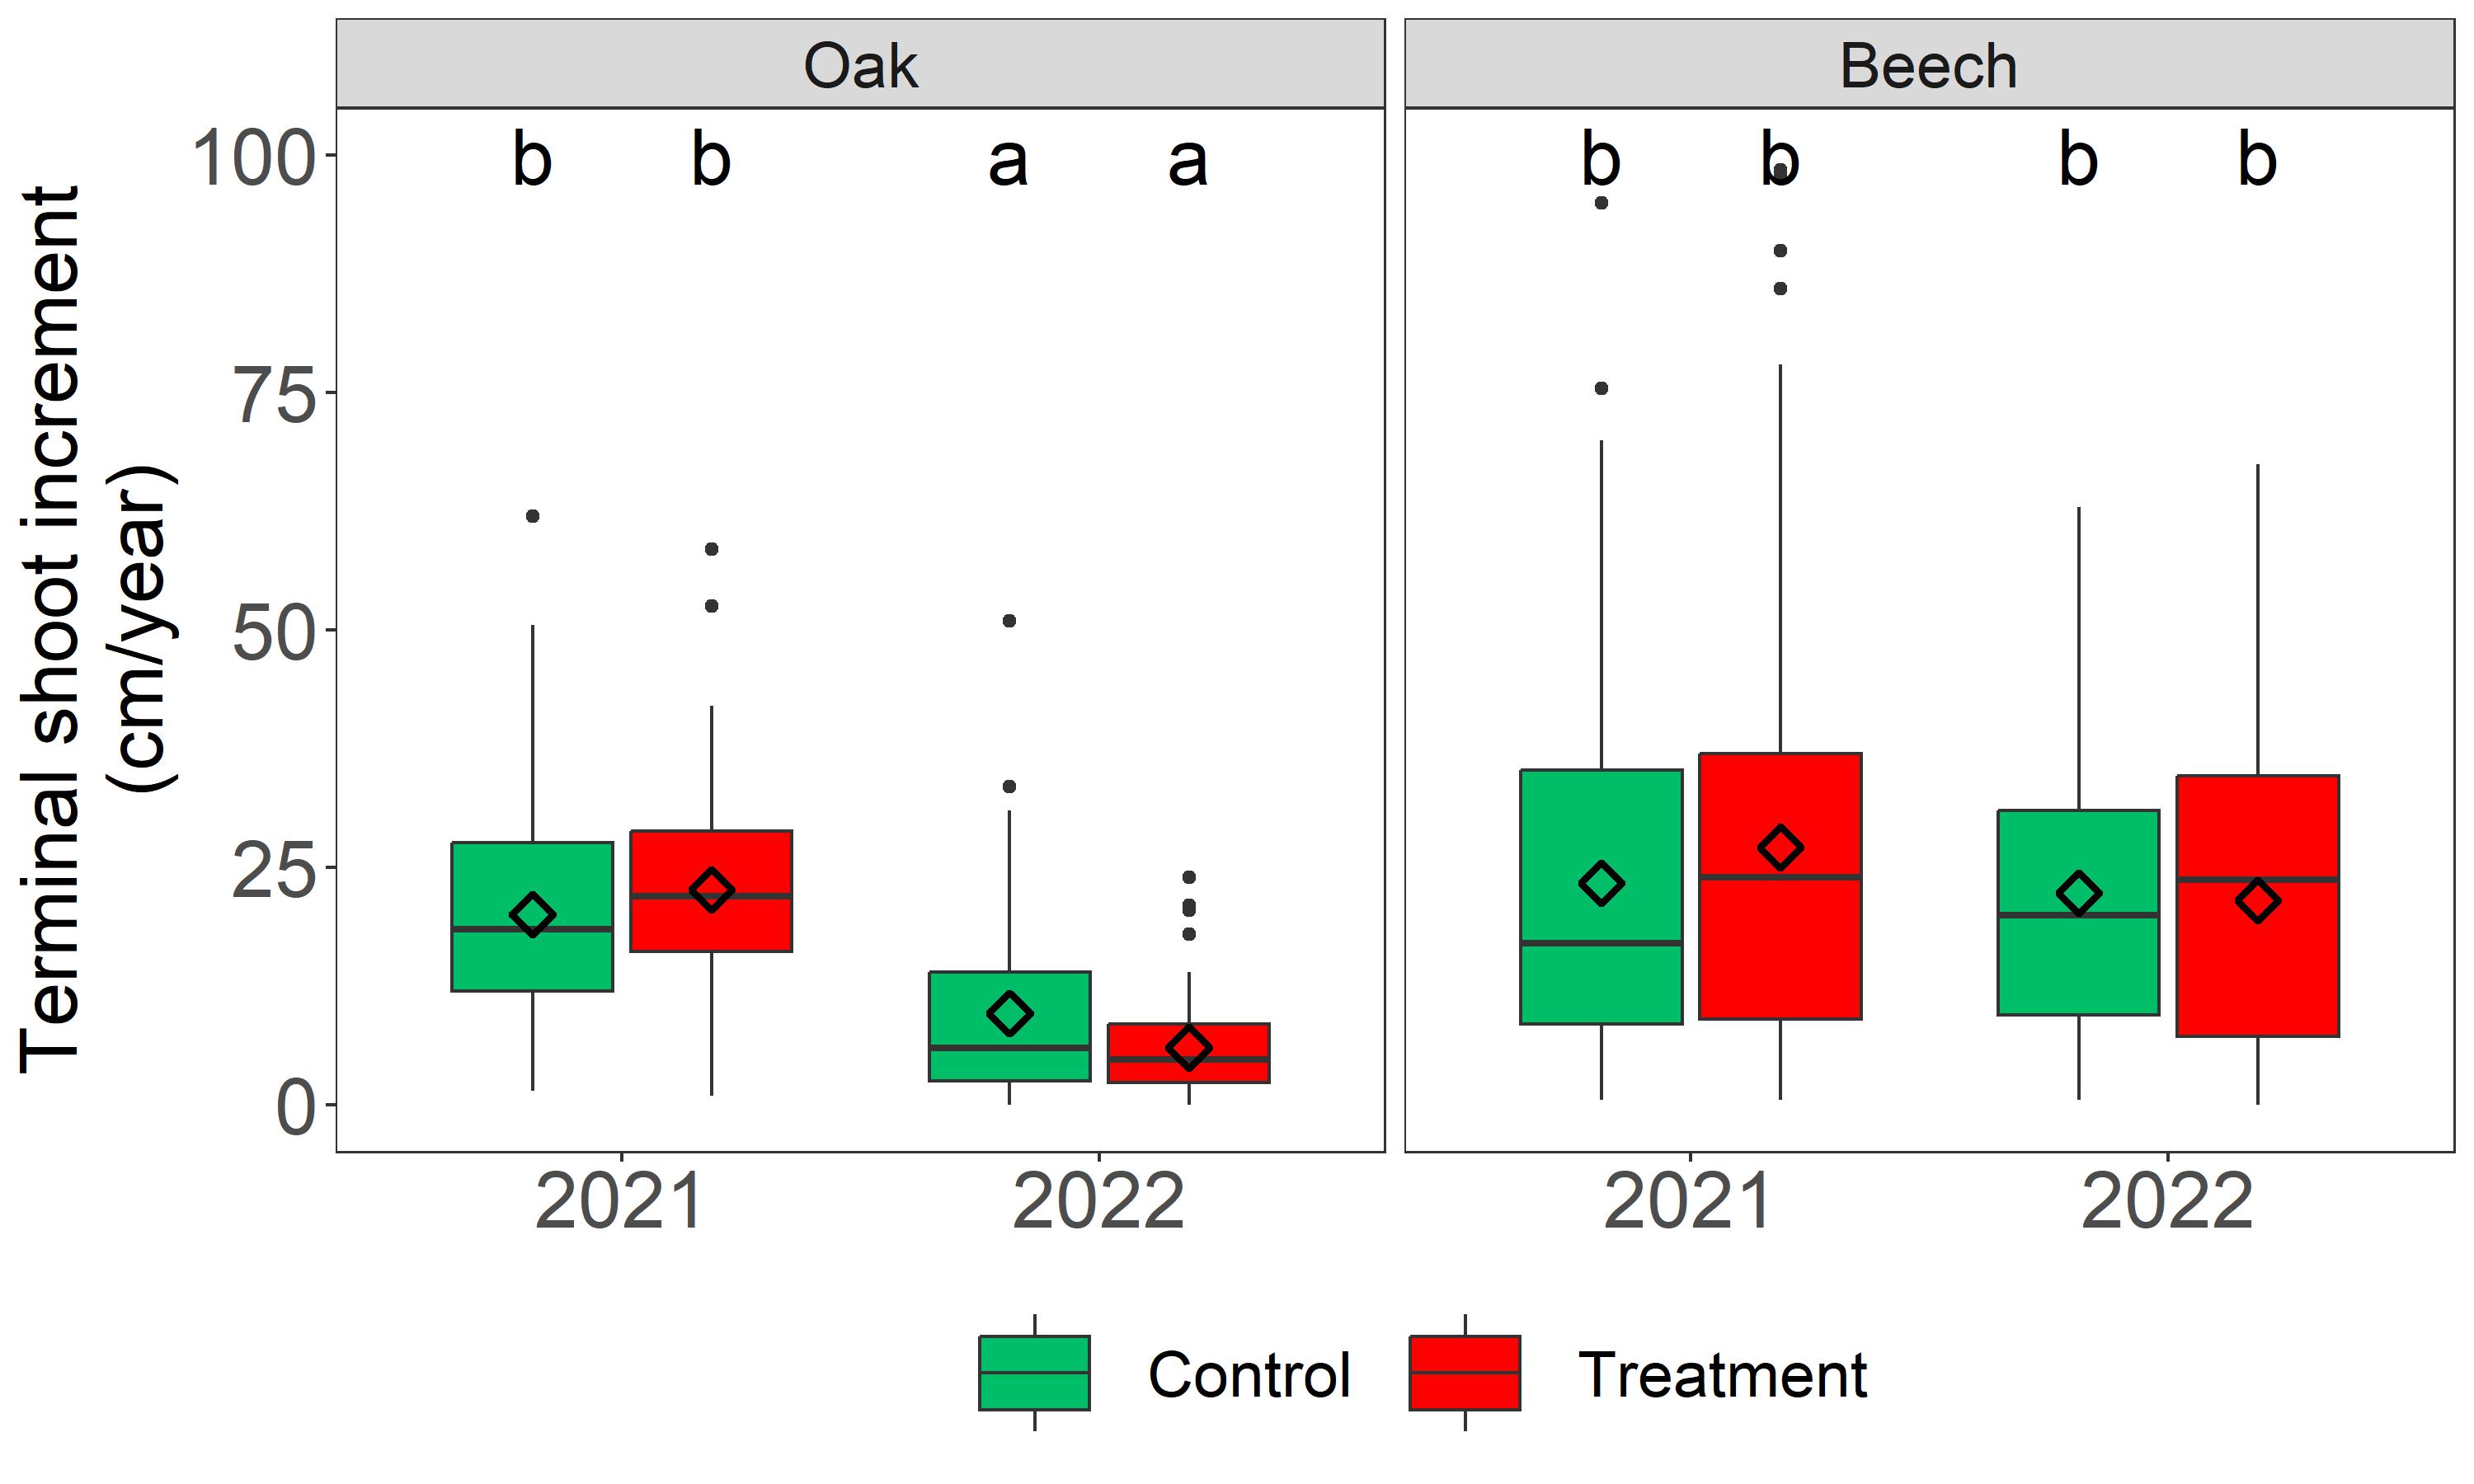
Terminal shoot increment
The lower and upper limits of the boxes represent the 25th and 75th data percentiles, respectively, while the intermediate lines correspond to the medians and the diamond symbols represent the means. The lower and upper whiskers are respectively minimum and maximum values. Dots are extreme values considered as outliers.
Different letters indicate statistically significant differences (P ≤ 0.05).
This section presents results for the dendrometric measurements performed in 2021 and 2022 on the 32 seedlings selected in each experimental unit. For both the collar diameter and the terminal shoot, significantly lower increment average values are generally observed for the year 2022 compared with 2021, the exceptions being the collar diameter increment for oak control zones and the terminal shoot increment of beech for which no significant difference is found between the two years. These generally lower increment values for 2022 compared with 2021 would arise from the contrasted meteorological conditions characterizing those years, especially with regard to rainfall amount and the resulting soil water content level, large rainfall depths and permanently high soil water contents having occurred during the growing period 2021 and inversely for 2022 (see results for soil water content above).
In contrast, the treatment effect is systematically not significant for both dendrometric variables, whatever the year. This could notably be explained by the quite similar soil water content levels observed in the control and the treatment units over those two years. Nevertheless, given the large soil water content differences arising among modalities since fall 2022, a significant treatment effect on seedling growth might be expected for the next growing season.


